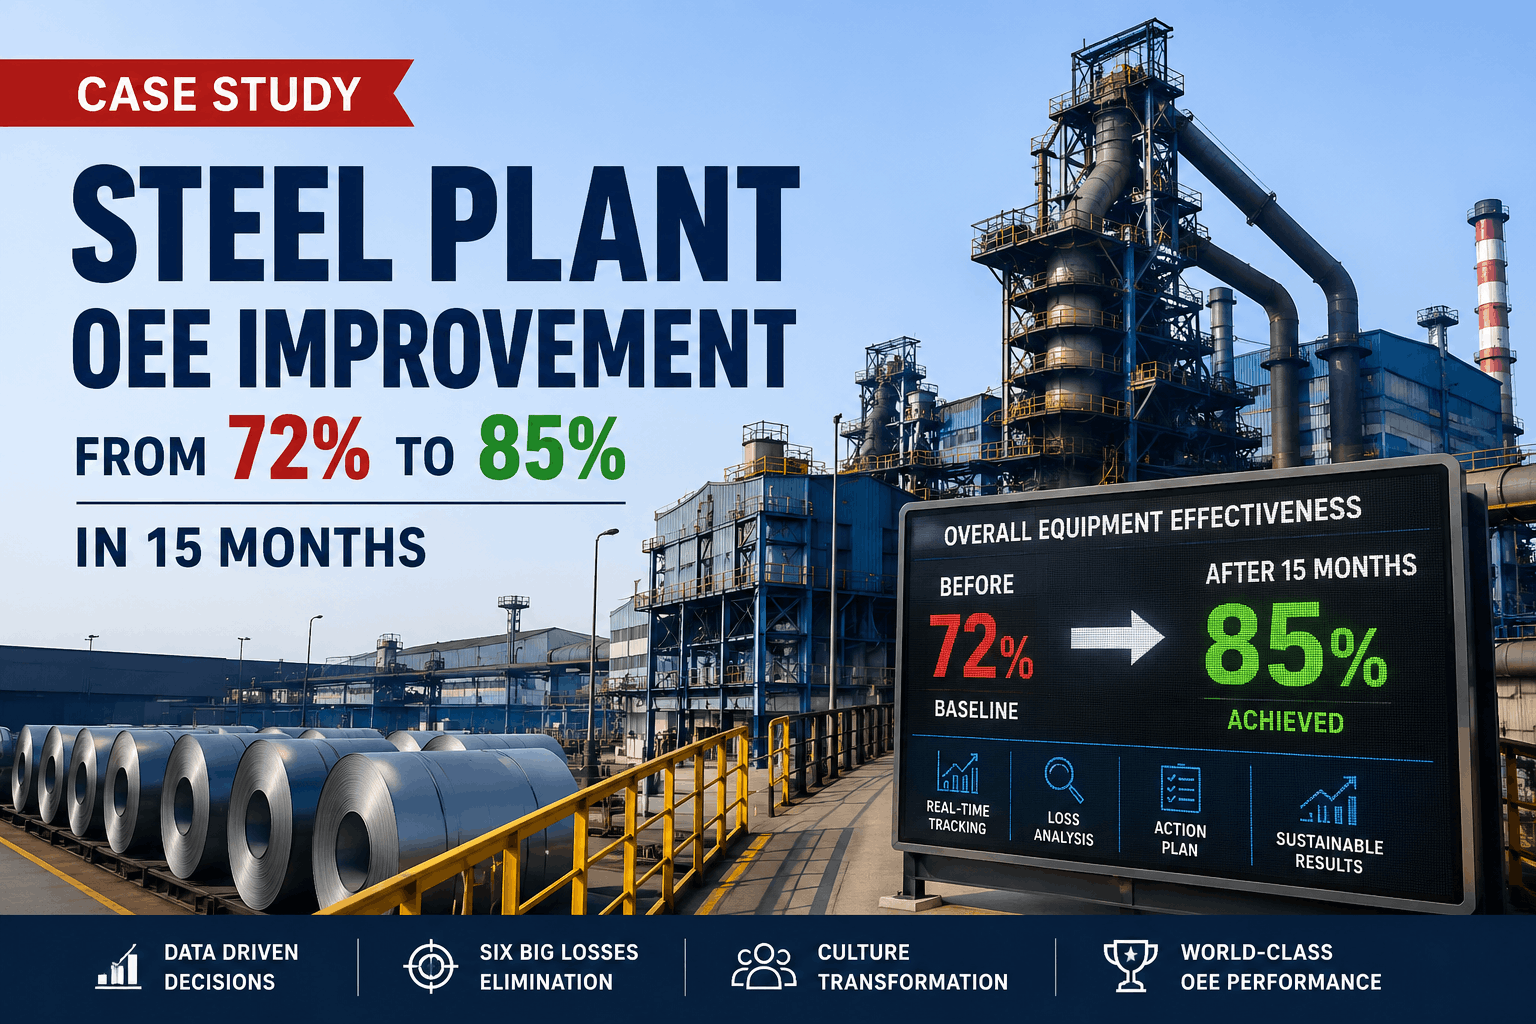
A medium-sized integrated steel plant operating a bar rolling mill was running at 72% OEE — well below the industry benchmark of 82-85%. The mill tracked overall equipment effectiveness manually, with data compiled from shift logs at the end of each week. The plant knew they had availability losses (unplanned downtime, extended changeovers), performance losses (micro-stops, reduced speed), and quality losses (scrap, rework) — but couldn't quantify which loss category was the largest driver, which shift was the worst performer, or which improvement action would deliver the highest ROI. After implementing Oxmaint's real-time OEE module with automated data collection from PLCs, loss category analysis, and shift-level dashboards, the mill improved OEE from 72% to 85% within 15 months, increased annual throughput by 28,000 tons, reduced quality scrap by 34%, and delivered $3.2M in annual productivity value. Start free — deploy real-time OEE tracking in your steel plant.
Steel Plant OEE Improvement from 72% to 85% in 15 Months — Real-Time Tracking & Loss Elimination
Case study: bar rolling mill deploys Oxmaint OEE module with PLC integration, real-time dashboards, loss category analysis, and shift-level tracking. OEE increases from 72% to 85%, throughput up 28,000 tons/year, quality scrap down 34%, $3.2M annual value delivered.
The Challenge — Manual OEE Tracking, No Real-Time Visibility
The bar rolling mill operated with annual capacity of 280,000 tons across two shifts. OEE was calculated manually at the end of each week, using data compiled from operator shift logs, maintenance work orders, and quality inspection records. The plant knew their OEE was 72%, but had no visibility into which loss category was the largest driver. Availability losses averaged 12% (80% availability), performance losses averaged 10% (90% performance), and quality losses averaged 6% (94% quality). But these were aggregate numbers with no time-stamped root cause data. The maintenance manager couldn't answer basic questions: Which shift had the highest unplanned downtime? Was the bottleneck the roughing stand, intermediate stand, or finishing stand? Were micro-stops caused by operator error, equipment condition, or material variability? Was the 6% quality loss concentrated in specific product sizes or steel grades?
Without real-time OEE data, improvement actions were based on intuition rather than evidence. The plant had attempted several improvement initiatives — operator training, PM optimization, roll change procedure revision — but none delivered sustainable OEE gains because the plant couldn't measure which actions actually worked. The operations director described the situation as "we're flying blind. We know we're losing 28% of our productive capacity, but we don't know where it's going." Book a demo to see how real-time OEE tracking answers these questions.
Real-Time OEE Architecture — PLC Integration to Operator Dashboard
The mill deployed Oxmaint's OEE module with four integrated layers: PLC connectivity for automated data collection, real-time loss categorization, shift-level dashboards, and action tracking. PLCs on the roughing, intermediate, and finishing stands streamed production counts, cycle times, downtime events, and reject counts directly into Oxmaint — eliminating manual data entry and its associated errors. The system automatically categorized each minute of lost production into one of the six big losses: equipment failure (availability), setup/changeover (availability), micro-stops (performance), reduced speed (performance), startup rejects (quality), and production rejects (quality).
Shift supervisors viewed live OEE dashboards on monitors mounted in the control room, showing current shift OEE vs. target, the largest loss category, and which stand was causing the most downtime. Operators could see in real time when OEE dropped below target and take corrective action immediately — not at the end of the week when the data was finally compiled. The system also tracked OEE by product grade, revealing that certain steel grades consistently had 8-12% lower OEE than the plant average due to increased roll wear and slower rolling speeds. This insight enabled targeted process adjustments for those grades, recovering 4,000 tons annually. Start free — deploy real-time OEE dashboards across your mill.
OEE Improvement Journey — Monthly Progress to 85%
The mill's OEE did not improve from 72% to 85% overnight. It improved through 12 distinct stages over 15 months — each stage representing a specific improvement action or system deployment. The stepped chart below shows how OEE progressed month by month, with the largest jumps occurring after the roughing stand bottleneck elimination (Month 6) and the changeover optimization (Month 10).
Loss Category Analysis — Where the 28,000 Additional Tons Came From
The mill's OEE improvement translated directly into increased throughput. At baseline 72% OEE, the mill produced 280,000 tons annually from 8,000 operating hours. At target 85% OEE, the same operating hours produced 308,000 tons — a 28,000 ton increase. The additional production came from eliminating specific loss categories. Availability loss reduction (12% → 5%) contributed 10,000 tons. Faster changeovers (45 min to 28 min) and reduced unplanned downtime (58% reduction) were the primary drivers. Performance loss reduction (10% → 6%) contributed 12,000 tons. Eliminating micro-stops (sensor misfires, guide adjustments) and optimizing rolling speeds for different steel grades drove this improvement. Quality loss reduction (6% → 4%) contributed 6,000 tons. Reduced startup rejects, dimensional rejects, and surface defects accounted for the gain.
The financial impact was substantial. At $150/ton contribution margin, 28,000 additional tons generated $4.2M in additional revenue. However, not all additional production was pure profit — the mill incurred variable costs for additional energy, rolls, and labor. Net contribution margin after variable costs was approximately $115/ton, yielding $3.2M in annual productivity value. The OEE improvement program cost $380,000 in software, sensors, and training — delivering an ROI of 842% in Year 1 alone. Start free — calculate your OEE improvement ROI.
Before Oxmaint, we calculated OEE at the end of each week using manual data entry from shift logs. By the time we saw a problem, it was already a week old. We knew our OEE was 72%, but we had no idea which shift was causing the losses, which product grade was the worst performer, or which stand was the bottleneck. The plant ran on intuition, not data. After deploying Oxmaint's real-time OEE module, everything changed. PLCs streamed production data directly into dashboards. Operators saw their OEE in real time. Shift supervisors could identify the largest loss category within minutes, not days. The first month, we discovered that the roughing stand was the bottleneck — 68% OEE compared to 74% on other stands. We focused improvement actions there and saw immediate gains. Over 15 months, we eliminated the roughing stand bottleneck, reduced changeover time from 45 minutes to 28 minutes, cut micro-stops by 62%, and reduced quality scrap by 34%. Our OEE improved from 72% to 85% — world-class for a bar mill. Annual throughput increased by 28,000 tons, delivering $3.2M in additional productivity value. The OEE program paid for itself in the first 90 days. Real-time OEE is not a nice-to-have. It's a must-have for any steel plant serious about productivity.
OEE Maturity — Where Does Your Steel Plant Stand?
OEE maturity reflects how effectively a plant measures and improves equipment effectiveness. The framework below assesses current state. This mill progressed from Level 2 (manual weekly OEE, 72%) to Level 4 (real-time PLC-integrated OEE, 85%) within 15 months.
Technology Integration: PLC Connectivity, Real-Time Dashboards, CMMS Sync
The mill's OEE system leverages three integrated technology layers. PLC connectivity streams production counts, cycle times, downtime events, and reject counts directly into Oxmaint — eliminating manual data entry and enabling real-time OEE calculation. Real-time dashboards display OEE by shift, product grade, and rolling stand, with color-coded alerts when OEE drops below target. CMMS sync ensures that any downtime event automatically creates a maintenance work order, linking production loss to maintenance action. Start free — integrate your PLCs with Oxmaint OEE module.
Frequently Asked Questions — OEE Improvement in Steel Plants
Deploy Real-Time OEE Tracking Across Your Steel Plant — Achieve World-Class 85%+ OEE
PLC integration, real-time dashboards, loss categorization, shift-level tracking, and CMMS work order sync — deployed in weeks, not months. Free to start.