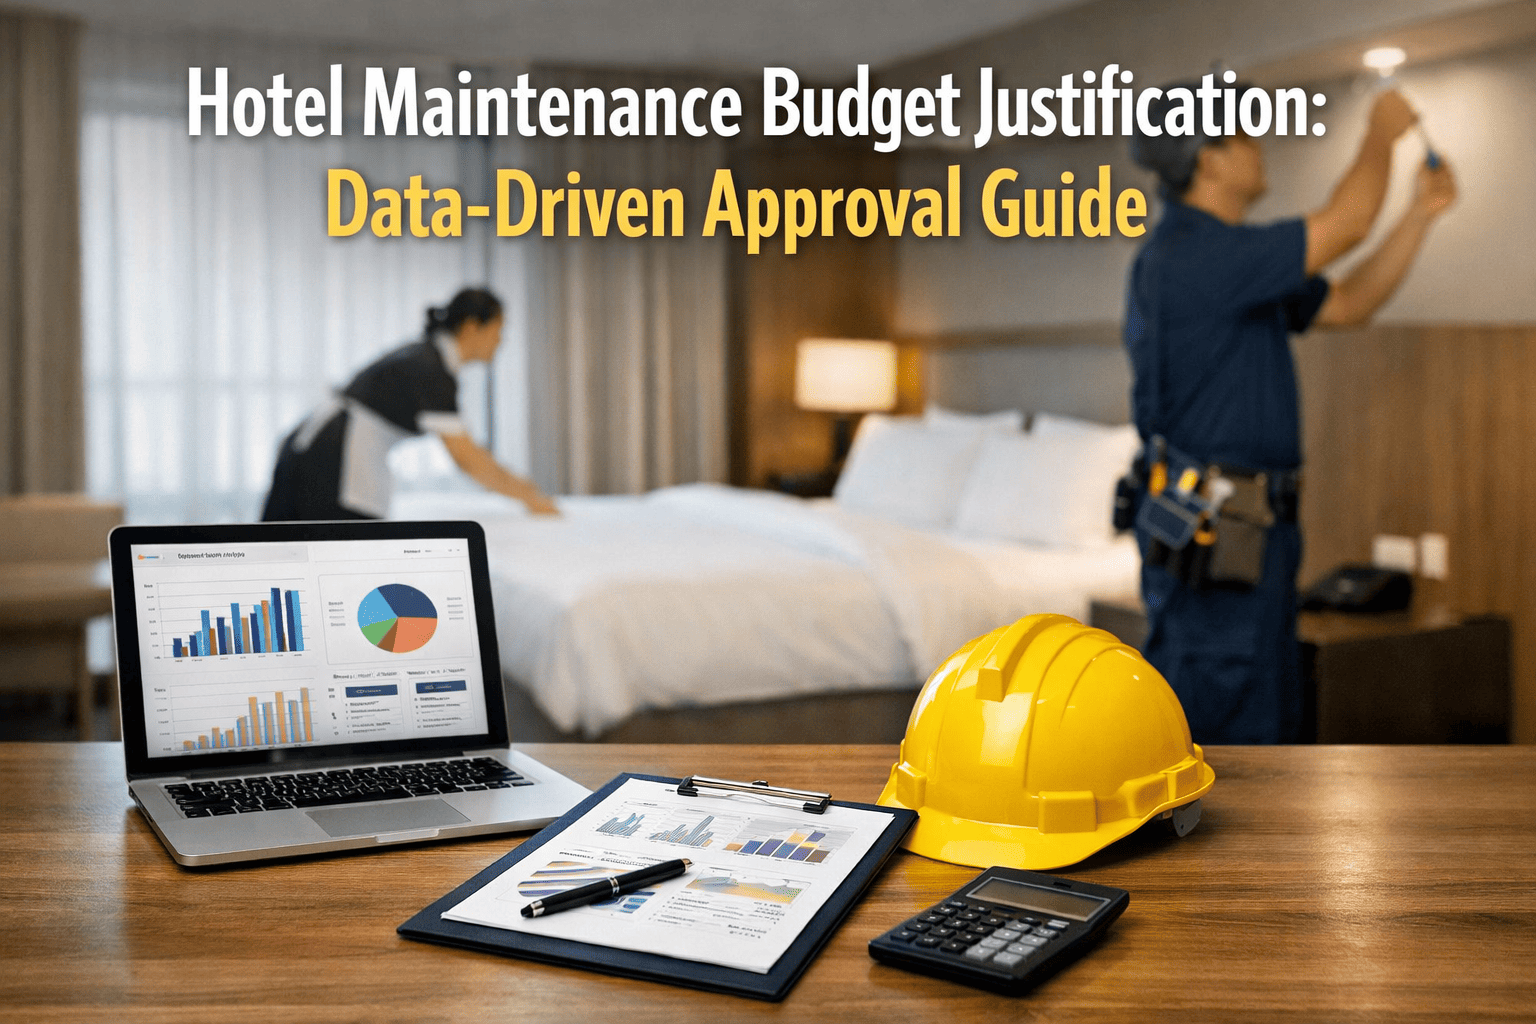
Every hotel engineering director faces the same challenge during budget reviews: proving why maintenance spend matters. Simply saying the budget is lean isn’t enough—ownership expects data, not assumptions. The teams that secure approvals use clear metrics like cost-per-room, deferred maintenance risks, and emergency repair trends. They present a strong, data-backed ROI for every request. This guide shows how to build a convincing, numbers-driven maintenance budget case.Sign up free to start capturing the CMMS data that ownership groups find credible, or book a demo to see the budget reporting dashboard before your next cycle.
Who This Is For
Hotel GMs, Directors of Engineering, and VP Operations preparing annual or mid-year maintenance budget presentations for ownership, asset managers, or brand representatives
What You Will Get
A step-by-step framework for building a data-backed maintenance budget case — from benchmark positioning to ROI modeling to CMMS-sourced evidence that ownership trusts
The Core Principle
Ownership does not deny maintenance budgets because they distrust engineering teams. They deny them because the requests are not framed in the language of asset protection and revenue risk — which this guide fixes
Step 1 — Know Where You Stand: Industry Benchmarks Ownership Recognizes
Before walking into any budget meeting, know how your current maintenance spend compares to industry benchmarks. Asset managers and ownership groups use these numbers constantly. When your request falls within recognized ranges and you can explain why, the conversation shifts from "justify this expense" to "confirm this is appropriate." Start a free trial to generate a benchmarked maintenance spend report from your own CMMS data before your next budget cycle.
Property Segment
POM as % of Revenue
Per-Room Annual Spend
CapEx Reserve (% of Revenue)
Deferred Risk Multiplier
Limited Service / Economy
4–6%
$800–$1,400
3–4%
1.8x if deferred
Select Service / Midscale
5–8%
$1,200–$2,100
4–5%
2.3x if deferred
Full Service / Upscale
6–9%
$1,800–$3,200
4–6%
2.9x if deferred
Luxury / Upper Upscale
7–11%
$2,800–$5,400
5–7%
3.4x if deferred
Age Adjustment
Properties over 15 years old: add 1.5–2.5% of revenue to POM baseline. Properties over 25 years old: add 2.5–4.0%. Properties post-major renovation (0–5 years): subtract 0.5–1.0%.
Source: CBRE Hotels Research, STR Global Benchmarking, USALI (Uniform System of Accounts for the Lodging Industry). Deferred risk multiplier represents average cost escalation when planned maintenance becomes emergency repair.
Step 2 — Build the Deferred Maintenance Liability Statement
The single most effective tool in a maintenance budget presentation is a deferred maintenance liability statement — a clear accounting of what happens financially if the requested budget is not approved. Ownership groups approve budgets that protect asset value. A liability statement reframes the conversation from "spending money on maintenance" to "preventing a larger capital event." Book a demo to see how Oxmaint CMMS automatically generates deferred maintenance liability reports from your work order history.
A
Current Deferred Work Value
List every maintenance task currently deferred — not completed due to budget, parts availability, or access constraints. Assign each a current repair cost using contractor quotes or CMMS historical data. Total = your deferred maintenance backlog.
Example: 14 open deferred work orders across HVAC, plumbing, and structural = $68,400 current repair cost
B
Failure Escalation Cost
Multiply each deferred item by the average escalation multiplier for its asset category — the ratio of emergency repair cost to planned repair cost. Industry averages range from 2.1x (structural) to 4.6x (chiller, elevator).
Example: $68,400 deferred backlog x 2.8 average escalation = $191,500 projected failure cost if deferred one more budget cycle
C
Revenue Risk Exposure
For each deferred item involving guest-facing or revenue-critical equipment, calculate the room revenue at risk if failure occurs during peak occupancy. Use your average ADR and typical repair downtime to quantify the exposure.
Example: Elevator deferred repair + 3-day failure risk during peak season x ADR $189 x 2 elevators reduced = $34,000 revenue exposure
D
Total Ownership Risk vs. Requested Budget
Present the math side by side: requested maintenance budget vs. projected liability if deferred. This is the number that changes budget conversations — because it shows ownership that denying the request does not save money, it moves costs.
vs.
$225,500
Projected Risk if Deferred
Step 3 — The Five Numbers Ownership Always Asks For
Asset managers and ownership groups reviewing hotel maintenance budgets consistently ask the same five questions. Engineering directors who have these numbers prepared — sourced from CMMS data, not estimates — move through budget approval significantly faster than those who return to the table with answers after the meeting.
01
"What did we spend on emergency repairs vs. planned maintenance last year?"
Why ownership asks: A high emergency-to-planned ratio signals a reactive maintenance program — which is the most expensive way to run a property and suggests the current budget is being misallocated.
Target ratio: Emergency repairs should not exceed 15–20% of total maintenance spend. Properties running above 30% emergency spend are significantly overpaying for maintenance.
How to find it: CMMS work order history — filter by work order type (planned PM vs. emergency/reactive) and sum costs by category.
02
"What is the current age and remaining useful life of our critical equipment?"
Why ownership asks: Equipment approaching end-of-life requires higher maintenance spend and creates CapEx replacement planning needs. Ownership needs this to model future capital requirements accurately.
Present this as an asset age matrix — equipment name, install date, expected lifespan, current age as % of lifespan, and projected replacement year with estimated cost.
How to find it: CMMS asset registry with install dates, manufacturer lifespan data, and replacement cost estimates from recent contractor quotes.
03
"How many room nights were lost to maintenance last year?"
Why ownership asks: This directly connects maintenance performance to revenue. A room blocked from inventory for 3 days at $189 ADR is $567 in lost revenue — ownership wants to see that maintenance is protecting sellable inventory.
Industry benchmark: Properties with structured PM programs block fewer than 0.8% of annual room nights for maintenance. Reactive-only properties average 2.1–3.4%.
How to find it: CMMS work orders filtered by "room out of service" status — count room-nights blocked and multiply by ADR for revenue impact figure.
04
"What is the cost per completed work order and how has it trended?"
Why ownership asks: This measures engineering efficiency. A rising cost-per-work-order may indicate aging equipment or labor inefficiency. A declining trend demonstrates that process improvements are delivering returns.
Benchmark: $85–$140 average cost per completed work order for a mid-size full-service property. Trending down year-over-year signals a maturing PM program.
How to find it: Total maintenance spend divided by total completed work orders from CMMS — segment by category (labor, parts, contractor) for granularity.
05
"What would we have spent without the PM program this year?"
Why ownership asks: This is the ROI question. Ownership wants to see that investing in preventive maintenance returns more than reactive-only operations would cost. Most engineering teams cannot answer this — those who can get budgets approved.
Model it: Take every PM-intercepted issue from CMMS logs. Estimate failure cost if not caught early (use escalation multipliers). Compare to PM labor and parts cost. The difference is your PM program ROI.
How to find it: CMMS PM completion records — tag each completed PM with "issue found" or "no issue." For issues found, log the estimated failure cost prevented vs. the PM execution cost.
Budget Cycle Preparation
All Five Numbers Come From Your CMMS — If Your CMMS Is Capturing the Right Data
Oxmaint CMMS automatically generates cost-per-work-order trending, PM ROI reports, room-night impact tracking, and equipment age matrices — the exact data package ownership groups expect.
Sign up free and run your first budget data report before your next ownership meeting.
Step 4 — Presenting CapEx Requests: The Format Ownership Approves
Capital expenditure requests fail at the ownership level for one consistent reason: they are presented as expense requests rather than investment cases. Every CapEx item in a maintenance budget should follow a four-field structure that ownership asset managers recognize from standard investment analysis.
Step 5 — The Language of Ownership: How to Frame Maintenance Spend
What Engineering Says
What Ownership Hears
What to Say Instead
"We need to replace the AHU belts before they fail"
"Routine maintenance cost"
"AHU belt replacement at $340 prevents a $4,800 emergency motor repair and 18 hours of HVAC downtime across 40 guest rooms"
"The elevator needs its annual service"
"Standard operating cost"
"Elevator PM at $1,200 maintains compliance and prevents the $18,000–$22,000 emergency repair event we averaged 2.1x per year before implementing the PM program"
"We're requesting $180,000 for maintenance this year"
"Large operating expense line"
"The $180,000 PM program is projected to prevent $420,000 in failure and revenue costs based on last year's CMMS data — a 2.3x return on maintenance investment"
"Equipment is getting old and needs more attention"
"Vague cost increase justification"
"Six assets have crossed 75% of design life. Attached asset age matrix shows $340,000 in projected CapEx requirements over the next 3 years — recommending phased reserves starting this budget cycle"
Frequently Asked Questions
What percentage of hotel revenue should go to maintenance?
Industry benchmarks from CBRE Hotels Research and USALI place Property Operations and Maintenance (POM) spend at 4–11% of total revenue depending on property segment. Full-service and upscale properties typically run 6–9%, while luxury properties commonly exceed 7–11%. Properties over 15 years old should add 1.5–2.5% to their segment baseline. Ownership groups recognize these ranges — presenting your request in this context positions the budget as appropriate asset stewardship rather than departmental overspending.
How do I justify a maintenance budget increase to skeptical ownership?
The most effective approach is a deferred maintenance liability statement paired with a PM ROI model. Show ownership the current cost of your backlog, the projected failure cost if deferred (using escalation multipliers by asset type), and the revenue at risk from guest-facing equipment failures. Then show what last year's PM program cost versus what it prevented. Ownership groups that see a 2.0–3.5x return on maintenance investment have a financial — not operational — reason to approve the budget.
What CMMS data should I pull for a maintenance budget presentation?
The five most impactful data points for ownership presentations are: (1) emergency vs. planned maintenance spend ratio for the prior year, (2) total room-nights blocked for maintenance and the ADR-based revenue impact, (3) cost-per-work-order trend over 12–24 months, (4) asset age matrix showing equipment approaching end-of-life, and (5) a PM ROI summary — cost of PM tasks completed vs. estimated failure cost prevented. A CMMS that captures and reports all five makes budget justification a data exercise rather than a judgment call.
How should hotel CapEx maintenance requests be structured for ownership?
Each CapEx request should follow a four-field investment case format: current asset status and performance data, cost of deferral using escalation multipliers and revenue risk, proposed investment with competitive quotes, and financial return including payback period and annual savings. Ownership groups evaluate CapEx using investment criteria — projects framed as "spending money on old equipment" routinely get deferred, while the same project framed as a 4.8-year payback with $14,200 in annual energy savings and $28,000 in avoided emergency costs gets approved.
When in the year should hotel maintenance budget planning start?
Leading practice is to begin maintenance budget preparation in August for Q4 budget cycle submission. This allows time to pull a full year of CMMS data (January–August actuals plus projected Q3–Q4), complete an asset age review, collect contractor quotes for CapEx requests, and build the deferred maintenance liability statement before the budget presentation. For branded hotels, the brand typically reviews first — meaning engineering data must be ready 3–4 weeks before ownership presentation.
Oxmaint for Budget Preparation
The Budget Data Ownership Expects Is Already in Your Work Orders
Oxmaint CMMS automatically generates the five ownership-ready reports that make maintenance budget approvals faster and more complete — PM ROI summaries, cost-per-work-order trends, room-night revenue impact, asset age matrices, and deferred maintenance liability statements. Walk into your next ownership meeting with numbers, not narratives.