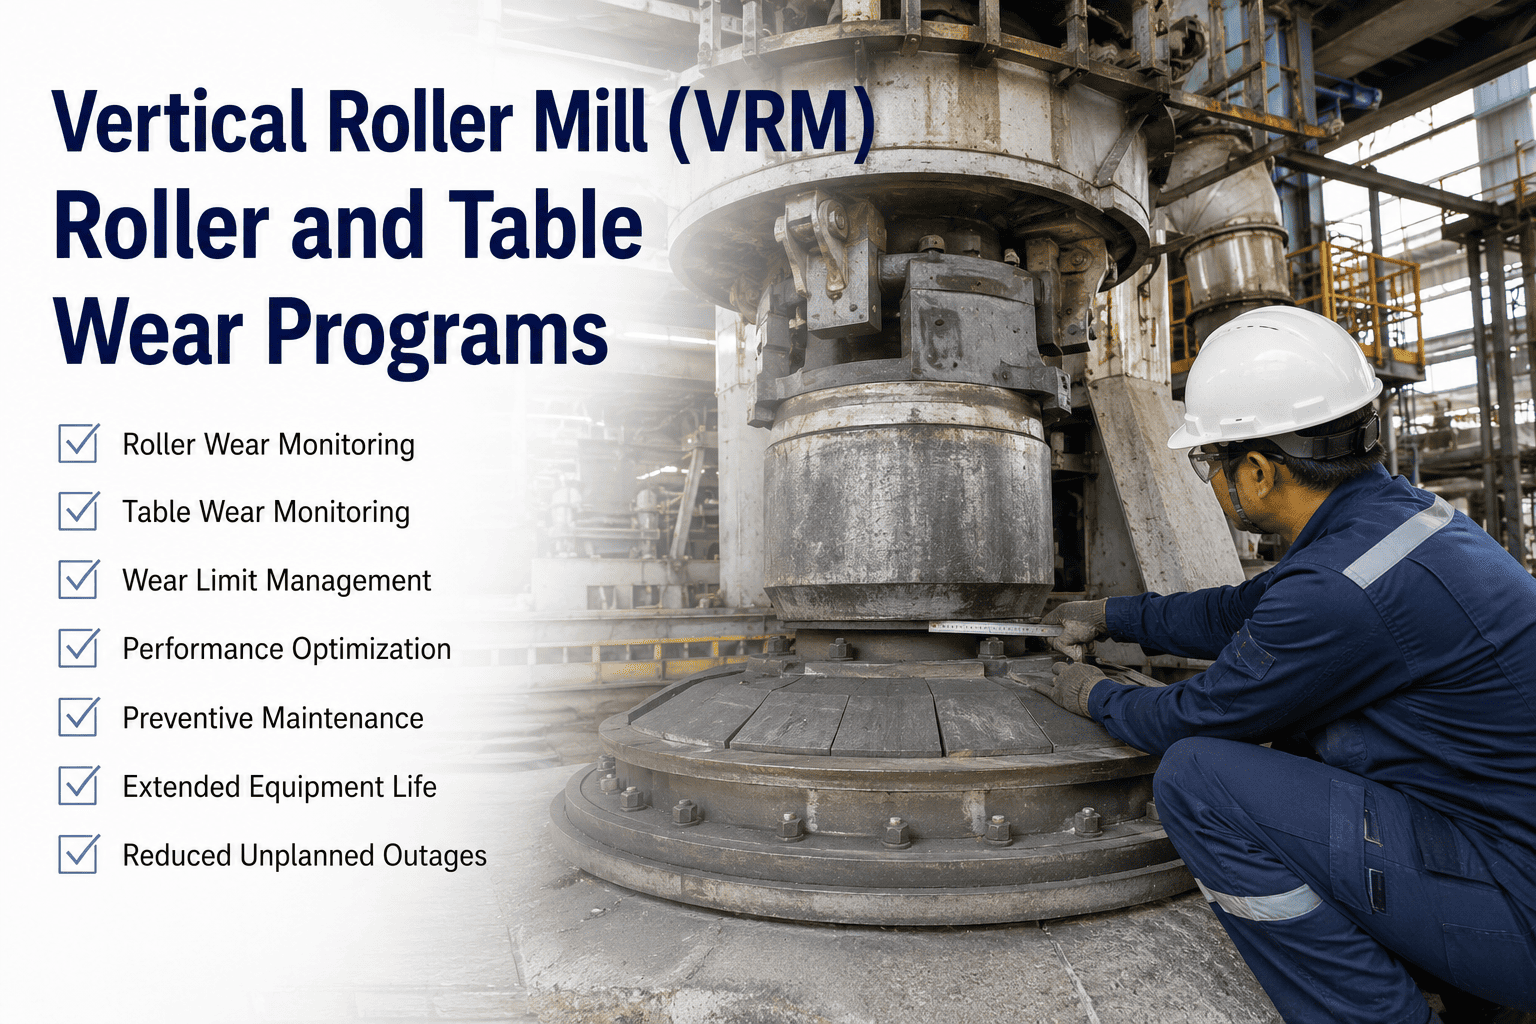
A vertical roller mill does not retire because its motor burns out or its gearbox fails — it retires because the rollers and table liners slowly lose the precise geometry that lets compression do its work, and most cement plants never see the loss happening until the kWh-per-tonne creeps up, the vibration starts drifting, and the throughput quietly drops by 8 to 12 percent. VRMs grind roughly seventy percent of the electrical energy consumed inside a cement plant, and every gram of wear on a roller tyre or table segment translates directly into lost grinding pressure, lost residence time, and lost margin. The plants that hold a VRM at peak efficiency for 20,000 hours and beyond are not the ones with thicker liners or harder alloys — they are the ones running disciplined wear programs where every thickness measurement, every hardfacing campaign, every reversal, and every separator vane inspection lives inside the same maintenance system that triggers the next intervention. That is exactly what plants build with the OxMaint CMMS platform.
VRM Roller & Table Wear Programs for Cement Plants
Hardfacing campaigns, hydraulic system tracking, separator wear records, and CMMS-driven lifecycle management for raw mills, coal mills, and finish-grinding VRMs.
The VRM Wear Lifecycle — Six Stages Every Roller and Table Goes Through
Wear on a vertical roller mill is not a single event — it is a continuous journey from commissioning geometry to condemn-thickness, and every stage has a different intervention window, cost profile, and lead-time requirement. Plants that skip stages or compress them lose 15 to 25 percent of the asset's available life. The lifecycle map below is how disciplined cement maintenance teams plan the next 8,000 to 12,000 operating hours for every roller and table on site.
Baseline Geometry & Profile Lock
Roller crown radius, table segment heights, and dam ring profile recorded immediately after commissioning. Becomes the reference contour against which every future measurement is benchmarked. Without this, all later condition triggers are guesses.
Linear Wear Phase
Predictable material loss at 8 to 15 g/t on raw mills, 4 to 6 g/t on coal and clinker grinding. Wear progresses uniformly across the contact band. Monthly ultrasonic thickness mapping detects no anomalies if feed gradation stays stable.
Profile Deviation Window
Crown radius starts deviating from design by 6 to 12 mm. Grinding pressure distribution shifts off-centre. Specific energy consumption rises 2 to 4 percent. This is the planning window where reversal and hardfacing campaigns are scheduled into the next kiln outage.
Reversal or Hardfacing Decision
Reversible roller segments rotated 180 degrees to expose unworn face. Non-reversible designs enter hardfacing campaign. Table segments hardfaced in place during the same outage window using automated mill kits running 24/7.
Second-Life Operation
Hardfaced surface delivers 50 percent lower wear rate than original liner — 0.12 g/T versus 0.30 g/T measured benchmarks. Multiple rewelding cycles possible on Hi-Chrome segments before component replacement becomes the only option.
Component Replacement
Roller tyres at 20 mm residual thickness or 12 mm profile deviation. Table segments below condemn threshold. Replacement parts ordered 90 days ahead using CMMS lead-time triggers. Old segments may go to OEM for refurbishment.
Why Roller and Table Wear Programs Are the Largest Hidden Cost in a Cement Plant
The published lifecycle cost of a VRM relining is rarely the real cost. What does not appear on the invoice is the four to seven percent throughput loss in the 90 days before the campaign, the additional 1.5 to 2.2 kWh per tonne of specific energy consumption from off-profile grinding, and the cascading wear acceleration on bearings, hydraulics, and separator components when bed pressure goes uneven. The breakdown below is what a disciplined wear program actually saves over a single 12-month operating cycle.
Roller tyre and table segment replacement parts, hardfacing consumables, and OEM-supplied spares. The only cost most plants actually track.
Throughput shortfall during off-profile grinding plus outage hours for the campaign itself. The single largest invisible cost in the program.
Additional kWh per tonne consumed when crown radius drifts beyond design tolerance. Compounds quietly across thousands of operating hours.
Bearing and hydraulic life shortened by uneven bed pressure. Separator vane erosion accelerated by oversize particle bypass. Quietly devastating.
The Four Wear Surfaces — What Each One Actually Costs and How It Is Tracked
A complete VRM wear program covers four distinct surface families, and each one has its own measurement method, intervention window, and CMMS record. Plants that focus only on roller tyres miss roughly 40 percent of the program's value, because table segments, dam rings, and separator vanes deteriorate on entirely independent timelines.
Roller Tyres & Liners
Table Segments & Liners
Dam Ring & Nozzle Ring
Separator Rotor & Vanes
Stop Treating Roller Wear as a Yearly Surprise. Run It as a Tracked Program.
OxMaint registers every roller, table segment, dam ring, and separator vane as an individual asset with its own thickness history, hardfacing record, and lifecycle forecast.
The Hardfacing Campaign Playbook — What 36 Hours of Disciplined Welding Actually Looks Like
An advanced hardfacing campaign on three to four rollers plus a table can be completed in roughly 36 hours of in-situ welding when planning, consumables, and automation are aligned. Plants that lack that discipline routinely turn the same job into a 96 to 120 hour event. The phase plan below is the operating standard used by experienced cement maintenance teams across Europe, North America, and Asia.
Pre-Campaign Profile Survey
Every roller and table segment mapped against design contour. Gouging plan generated. Welding wire heat numbers logged into asset record. Hot-work permits issued through CMMS. Mill nitrogen-purged and locked out.
Gouging & Build-Up
Fatigued material gouged out to clean base metal. Multi-pass build-up welding using application-specific wire restores dimension to within 3 mm of design. Each pass logged with parameters — current, voltage, travel speed, interpass temperature.
Hardfacing Overlay
Final wear-resistant cap deposited at 55 to 67 HRC. Automated mill kits run 24/7, one kit per roller, both rolls hardfaced simultaneously. Pattern, bead spacing, and overlay thickness controlled to 1 mm.
Stress Relief & Profile Check
Controlled cooling and stress relief on critical sections. Final profile gauged against design template. Deviations beyond 2 mm reworked. Hardness verified at random points across the overlay band.
Documentation & Asset Record Update
Heat numbers, welding parameters, deposit thickness, and hardness data logged against every component in the CMMS. Next campaign window calculated. RUL engine recalibrated for new baseline.
Live VRM Wear Tracking — What the Asset Record Looks Like Mid-Cycle
The asset record below shows what disciplined wear tracking looks like for a single 5-roller VRM mid-cycle. Every component carries its own measurement history, RUL projection, and next-action trigger — and the maintenance scheduler sees all of it from one screen instead of chasing it across spreadsheets, logbooks, and OEM spreadsheets that nobody updates.
Reactive vs Tracked Wear Programs — The Cost Gap Is Not Marginal
Most cement plants discover they have a wear problem when throughput drops or vibration trips. By that point the program has already cost two to three times what a tracked approach would have spent. The comparison below is what plants typically see in the first 12 months after moving from calendar-based liner replacement to a CMMS-driven wear program.
| Program Element | Reactive (Calendar-Based) | Tracked (CMMS-Based) | Annual Impact |
|---|---|---|---|
| Roller Tyre Utilisation | 60–70% of available life used | 92–96% of available life used | +25% life captured |
| Hardfacing Campaign Duration | 72–96 hours per campaign | 36–48 hours per campaign | −50% outage hours |
| Specific Energy Consumption | Drifts +1.5 to 2.2 kWh/t pre-campaign | Stable within 0.3 kWh/t band | 4.8% kWh/t reduction |
| Throughput Loss Pre-Campaign | 8–12% reduction over 90 days | Under 2% across full cycle | Recover 35K+ t/year |
| Emergency Liner Failures | 1–2 events per year typical | Near-zero after first cycle | $280K–620K avoided |
| Spare Parts Lead-Time | Expedited freight, premium pricing | 90-day forecast, standard freight | 12–18% parts savings |
The Six CMMS Practices That Actually Extend VRM Wear Life
Cement plants that consistently push roller and table life past 16,000 operating hours all follow the same six practices inside their CMMS. None of them are exotic — but they have to be running together, not in isolation, and they have to be enforced through scheduled work orders rather than left to operator memory.
Roller Profile Mapping
12-point ultrasonic thickness measurement on every roller, plotted against design contour. Profile deviation tracked separately from residual thickness — the better predictor of grinding efficiency loss.
Hydraulic Accumulator Check
Nitrogen pre-charge pressure verified against OEM spec. Drift of 4 bar or more triggers bladder leak test. Lost grinding force is the silent killer of roller wear uniformity.
Table Segment Inspection
Visual crack inspection, template gauge against design, photographic record of each segment. Asymmetric wear caught early prevents cascade damage to neighbouring segments.
Specific Energy Trending
kWh per tonne tracked daily, plotted on a rolling 30-day chart. Drift above 0.5 kWh/t triggers wear investigation. Earliest leading indicator of profile deviation before any thickness measurement confirms it.
Dam Ring & Nozzle Audit
Dam ring height measured at four points. Nozzle ring pressure drop verified. Adjustments to bed-pressure setpoint logged for trending against wear progression.
Separator Vane & Tromp Check
Vane erosion measured. Product residue tested against fineness spec. Tromp curve plotted to detect bypass that accelerates rotor wear and reduces grinding circuit efficiency.
What 16 Months of Disciplined Wear Tracking Returns
The figures below come from cement plants that moved their VRM wear program out of spreadsheets and into a tracked CMMS workflow. They are not aspirational targets — they are documented outcomes that compound across the first full operating cycle and accelerate from there.
From 0.30 g/T baseline to 0.12 g/T after disciplined hardfacing campaign. Documented across multiple cement VRM installations.
Roller tyres reaching 92 to 96 percent of available life instead of being changed early on calendar schedule.
kWh per tonne reduction from stable bed pressure, uniform grinding profile, and on-spec dam ring height.
Compressed in-situ hardfacing window for 3 to 4 rollers plus table, versus 72 to 96 hours in reactive programs.
Frequently Asked Questions
Every Roller Reversal, Every Hardfacing Bead, Every Liner Hour Should Live in One System
The cement plants that hold VRM efficiency at peak for 20,000 hours and beyond all share one thing — their wear data, their campaigns, and their lifecycle forecasts all run inside the same maintenance system.