Pharmaceutical manufacturing is one of the most energy-intensive sectors in global industry — with energy costs representing 5–10% of total operating expenses at a typical US or European drug product facility. Yet the majority of that energy waste is not structural: it is maintenance-driven. Compressed air leaks, steam trap failures, HVAC set-point drift, and chiller efficiency decay are all conditions that develop gradually, are invisible to production teams, and are only detected — if at all — through dedicated maintenance analytics. A pharma energy waste maintenance dashboard changes the economics of utility management by surfacing these losses in real time, converting each identified source into a work order before it compounds into a significant cost. This article covers the four primary energy waste categories in pharma plants, the data sources that make them visible, and the measurable outcomes that Oxmaint customers report after deploying utility analytics within their maintenance management platform.
Sustainability
Energy Analytics
Utility Maintenance
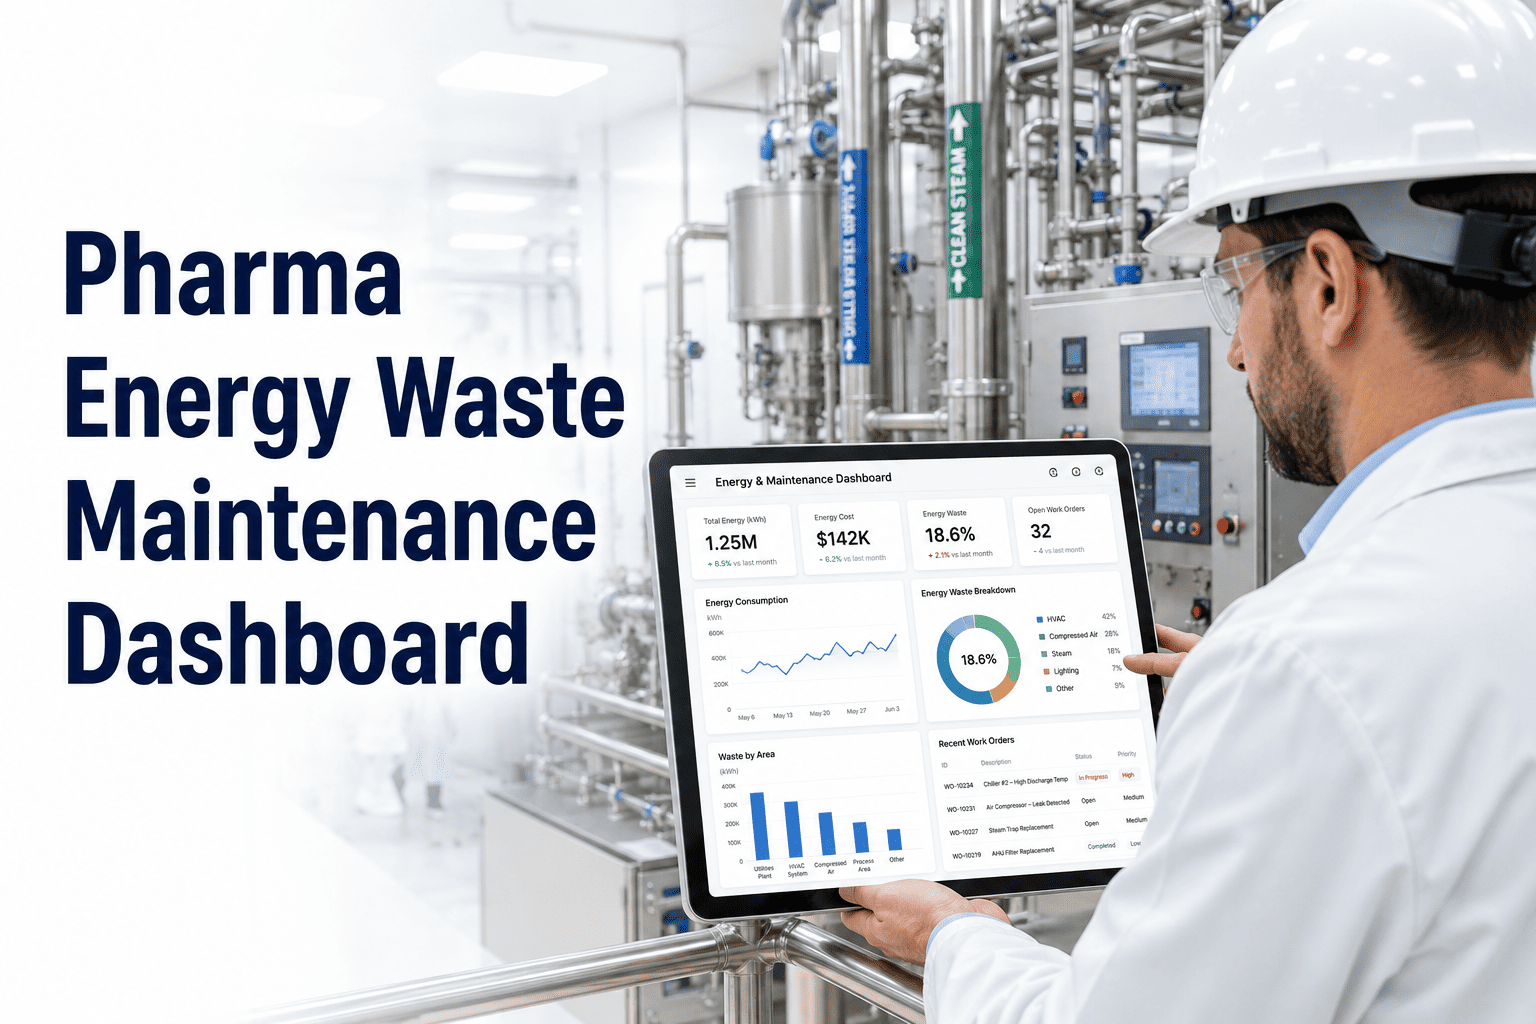
Pharma Energy Waste Maintenance Dashboard
Compressed air, steam, HVAC, and chillers — the four utility systems hiding the most recoverable energy in pharmaceutical manufacturing. Here's how a maintenance dashboard finds and eliminates them.
$2.1M
Average annual energy waste at a mid-size pharma plant from unaddressed utility losses
30%
Of compressed air production typically lost to leaks in unmanaged pharma facilities
15–25%
Reduction in utility energy spend achievable within 18 months with maintenance dashboard
60–70%
Of steam system energy losses attributable to failed steam traps and uninsulated lines
Waste Map
Where Energy Disappears in a Pharma Plant
Energy waste in pharma manufacturing is not random — it concentrates in four utility systems that run continuously, degrade predictably, and are rarely monitored between scheduled maintenance events. The chart below shows typical energy waste distribution by source, based on facility audits across US and Canadian pharmaceutical sites.
Source: US DOE Advanced Manufacturing Office, Pharma Facility Energy Benchmarks 2022
Four Waste Categories
What the Dashboard Finds — and What It Costs Without Maintenance Action
$38,000–$92,000/year per unmanaged system
A 1/4-inch leak at 100 PSI wastes approximately 25 CFM continuously — costing roughly $8,000 per year in compressor energy at industrial electricity rates. A typical unmanaged pharma compressed air system has 15–25 active leaks. The dashboard flags leaks via pressure decay analysis on sub-meters, correlating flow anomalies with production scheduling to confirm the leak is not a legitimate demand event.
Dashboard Signal:
Pressure drop rate anomaly during scheduled non-production window
$55,000–$140,000/year per unmanaged steam system
Failed steam traps are the primary loss mechanism — a single failed-open trap can waste $15,000–$30,000 in fuel annually. The dashboard integrates steam flow meter data with condensate return rates to calculate trap efficiency in real time. Traps operating outside the expected condensate return ratio trigger a corrective work order with the trap location, age, and recommended replacement type pre-populated.
Dashboard Signal:
Condensate return rate below baseline for trap circuit — work order auto-generated
$28,000–$75,000/year per facility in over-conditioning costs
HVAC set points drift when controllers are adjusted informally to address comfort complaints or production variation — and are never returned to the energy-optimized baseline. A cleanroom air handler running 2°C colder than its validated lower limit due to an informal operator adjustment wastes 8–12% of that unit's annual energy. The dashboard tracks set-point deviation from validated baselines continuously, flagging any excursion that persists beyond a configurable time window.
Dashboard Signal:
Set-point deviation persisting 4+ hours beyond scheduled production — HVAC PM triggered
$44,000–$110,000/year per chiller as COP degrades
A chiller's coefficient of performance (COP) degrades with fouled heat exchangers, refrigerant charge deviation, condenser water temperature rise, and compressor wear. A 15% COP reduction on a 500-ton chiller adds $40,000–$60,000 in annual electricity cost. The dashboard monitors kW/Ton in real time against the chiller's baseline performance curve, triggering a PM work order when efficiency crosses a predefined threshold — before the degradation compounds further.
Dashboard Signal:
kW/Ton exceeds seasonal baseline by 12% — condenser cleaning PM dispatched
See your energy waste — before the utility bill does
Oxmaint's maintenance dashboard connects to your utility metering and building systems to identify compressed air leaks, failed steam traps, HVAC drift, and chiller efficiency loss — and converts every finding into a scheduled work order.
Measured Outcomes
What Pharma Sites Achieve After Deploying Energy Waste Dashboards
18%
Average reduction in compressed air energy spend — Year 1
$380K
Average annual utility savings at a 100,000 sq ft pharma facility after dashboard deployment
8 months
Average payback period for energy waste programme investment at mid-size sites
22%
Reduction in Scope 2 carbon emissions attributable to utility maintenance improvements
Expert Review
Utility Systems Engineer — Pharmaceutical Manufacturing, US & EU
"The pharma industry has been focused on GMP compliance for so long that the energy performance side of utility management has been almost entirely reactive. Steam trap surveys happen once a year at best. Compressed air leak audits are driven by complaints, not data. What changes when you connect your utility metering to the CMMS is that every loss becomes visible — and the maintenance response is automatic. The teams I work with cut their compressed air energy spend by 18–25% in the first year just by responding to what the dashboard shows them. The ROI is often faster than any capital project on the site."
30%
Of compressed air energy in unmanaged pharma plants is consumed by leaks — the industry norm, not the exception
Top 3
Energy waste sources in pharma: steam losses, compressed air leaks, and over-conditioned cleanrooms
FAQ
Frequently Asked Questions
What data sources does a pharma energy waste dashboard need to function?
At minimum, an effective energy waste dashboard needs: compressed air flow and pressure sub-metering at zone or header level, steam flow meters and condensate return measurement per circuit, HVAC controller set-point data (via BACnet, Modbus, or OPC-UA), and chiller power meter data with leaving water temperature. Most pharma sites already have the majority of this instrumentation — the gap is typically in connecting it to a unified analytics platform.
Oxmaint integrates with standard building automation protocols and utility metering systems to pull this data into the maintenance dashboard without requiring a separate energy management software layer.
How does an energy waste dashboard connect to maintenance work orders?
When the dashboard detects an anomaly — a pressure decay signature indicating a compressed air leak, a condensate return deficit pointing to a failed trap, or a kW/Ton excursion on a chiller — it automatically generates a corrective work order in the CMMS with the location, the suspected failure mode, the energy cost of the current loss rate, and the recommended corrective action pre-populated. The maintenance team receives a work order like any other, with the urgency and scheduling determined by the loss rate and the asset's criticality.
Book a demo to walk through the full alert-to-work-order flow for each utility type.
Can HVAC set-point drift monitoring conflict with GMP cleanroom controls?
No — the energy waste dashboard monitors against the validated baseline, not against a separate energy target. If the validated operating range for a cleanroom is 20–22°C and the set point has drifted to 18°C, the dashboard flags the deviation because it is outside the validated range — which is simultaneously an energy waste and a GMP excursion. The energy savings and the GMP compliance interest are aligned. Oxmaint's CMMS links the HVAC set-point monitoring to the cleanroom's environmental monitoring record, so a single alert serves both the sustainability programme and the GMP compliance team.
How does a pharma site build the business case for an energy waste maintenance programme?
The fastest path to a defensible business case is a utility loss audit of the three highest-consumption systems: compressed air, steam, and chillers. Industry benchmarks suggest a mid-size pharma facility (250,000–500,000 sq ft) loses $800K–$2M annually in recoverable utility waste. Even a 15% reduction represents $120K–$300K in annual savings against a programme cost of $40K–$80K, yielding 2–4 month payback on typical US industrial electricity and gas rates.
Oxmaint's dashboard tracks actual savings in real time against the pre-programme baseline, so the ROI case grows stronger with every work order closed.
Every missed leak, failed trap, and drifting chiller is a line item on your utility bill
Oxmaint's energy waste maintenance dashboard finds each loss, calculates its annual cost, and converts it into a maintenance work order — automatically, across compressed air, steam, HVAC, and chiller systems.