Steam is the backbone of pharmaceutical manufacturing — sterilization, process heating, clean-in-place systems, HVAC, and humidification all depend on it. It is also one of the largest sources of untracked energy waste in any pharma plant. Industry data shows that 15 to 30% of steam traps in a typical industrial facility are failing at any given time, and a single failed-open trap can waste up to 75.8 lbs of steam per hour — costing over $6,600 per year per trap. Multiply that across the hundreds of traps in a mid-size pharma campus and the hidden cost becomes a plant-director conversation. OxMaint connects steam trap survey data, insulation task tracking, and work order management in one platform so failed traps become work orders, savings are documented, and utility costs go down — not just on paper but in your monthly bills. This guide shows pharma plant managers exactly where steam energy is being lost and how to recover it systematically. If your plant is still managing steam maintenance through spreadsheets and site walks, book a 30-minute demo to see how OxMaint structures steam energy programs for pharma plants.
Energy Savings Guide · Pharma Plants
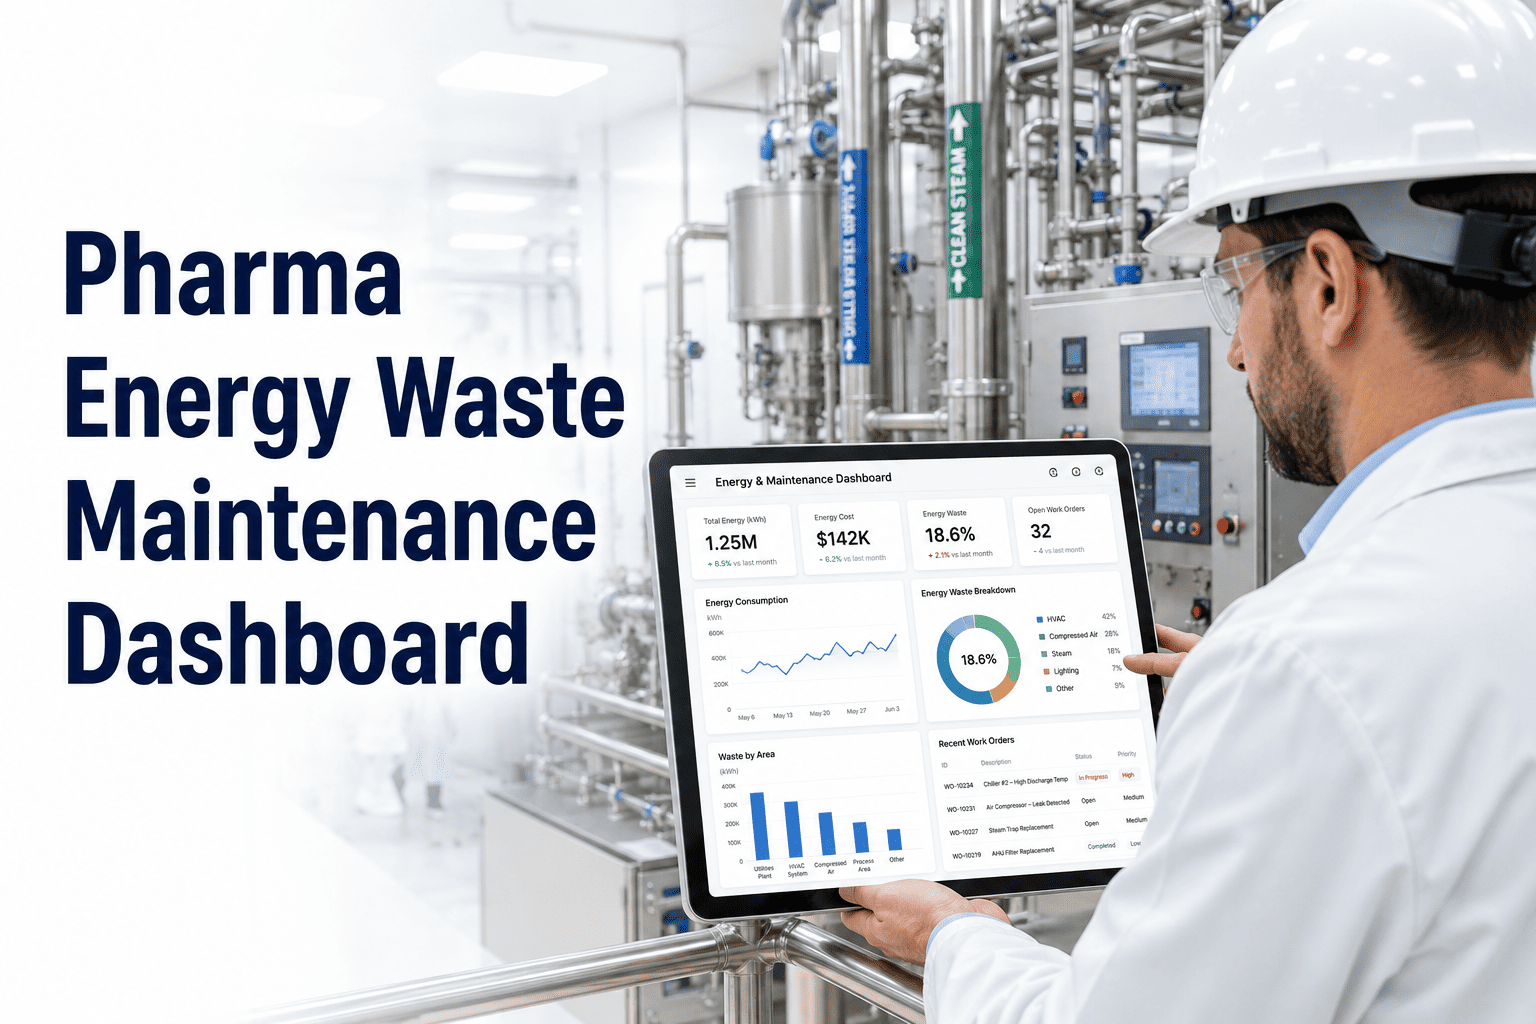
Steam System Energy Savings for Pharma Plants
Reduce utility costs through steam trap surveys, insulation audits, leak work orders, and real savings dashboards — all tracked in one CMMS built for pharma plant reliability.
15–30%
of industrial steam traps failing at any point in time
75.8 lbs
of steam wasted per hour from a single failed-open trap
$6,640+
annual cost of one failed steam trap at $10/1,000 lbs steam
5–10%
system efficiency gain from a full insulation audit and repair program
Where Steam Energy Disappears in a Pharma Plant
Steam losses are invisible until you measure them. These four areas account for the majority of recoverable waste in pharmaceutical steam systems.
40–60%
Failed Steam Traps
Open-failure traps pass live steam directly to condensate return
20–30%
Pipe Insulation Gaps
Missing, damaged, or degraded insulation on distribution lines
10–20%
Steam Leaks at Joints
Flange gaskets, valve packing, and fitting wear-through
5–15%
Boiler Inefficiency
Combustion tuning, blowdown frequency, and heat recovery gaps
The Steam Energy Savings Roadmap for Pharma Plants
01
Steam Trap Survey
Foundation Step
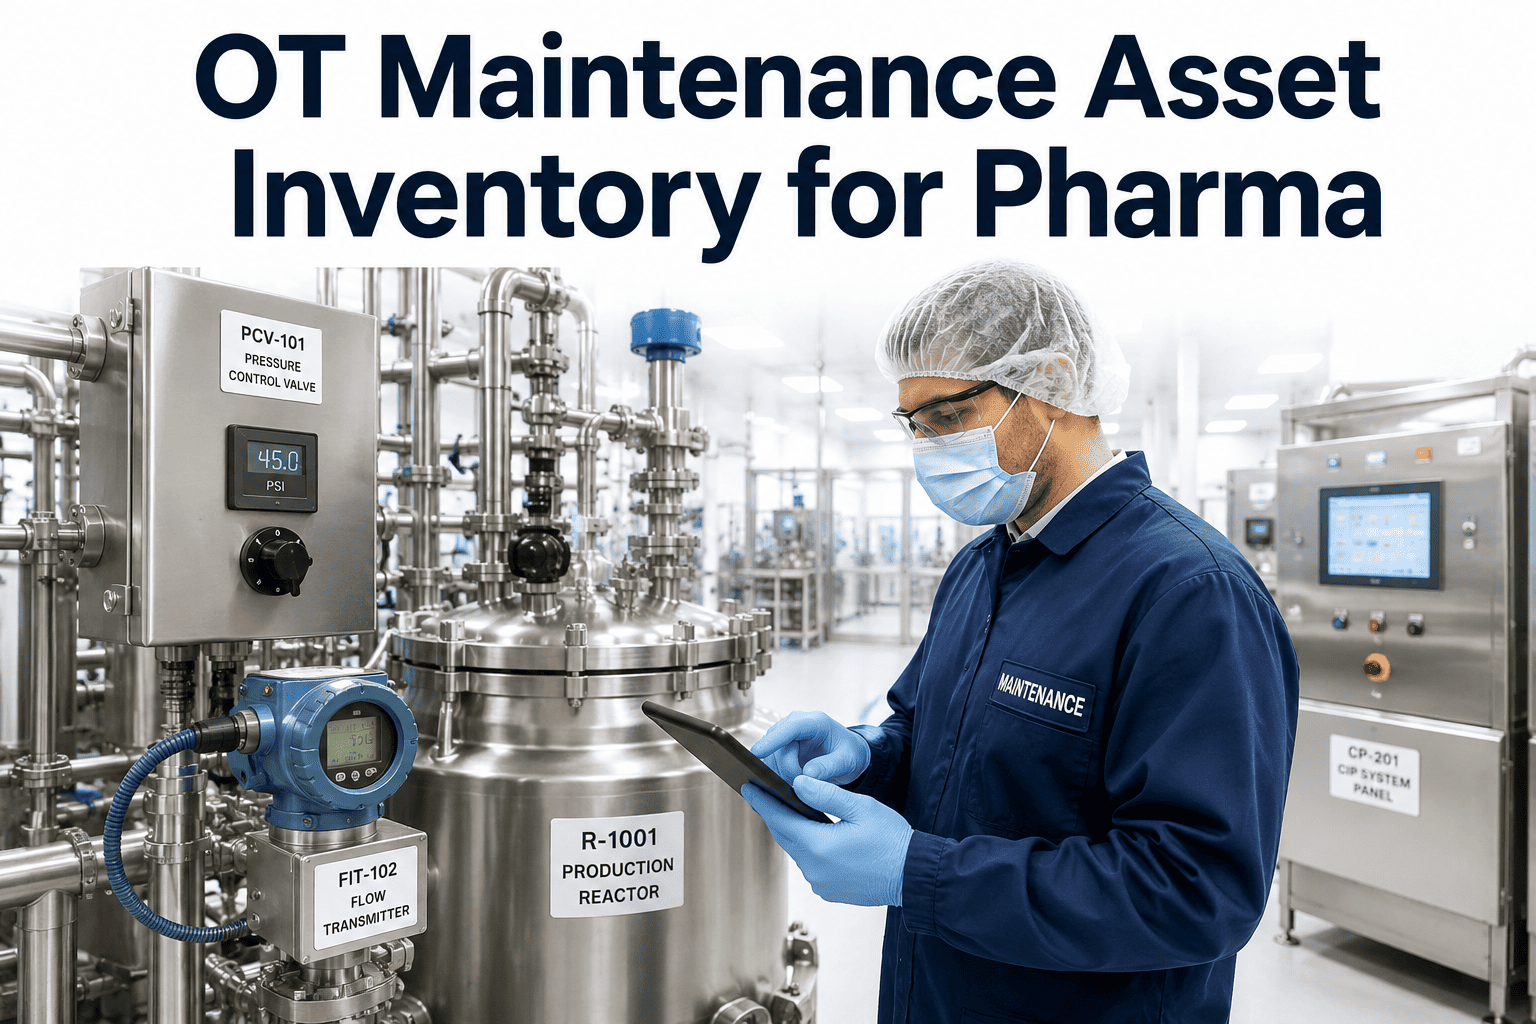
A steam trap survey tags and tests every trap in the plant — identifying failed-open traps (passing steam), failed-closed traps (blocking condensate), and bypassed traps. Survey data enters OxMaint as an asset inventory with failure status. Each failed trap automatically generates a repair work order prioritized by estimated annual steam loss.
Typical trap failure rate in unmanaged systems: 15–30%
Payback on trap replacement programs: under 6 months (DOE)
A 20,000-trap survey program found 15–31% failure rates at surveyed sites
02
Insulation Audit
High ROI Step
Walking steam distribution lines and identifying missing or degraded insulation is one of the highest-ROI tasks in pharma steam management. Infrared thermography reveals heat loss that is invisible to the naked eye. OxMaint logs each insulation deficiency as a work order tied to the pipe segment, with estimated heat loss and repair cost attached for prioritization.
Full insulation program typically delivers 5–10% system efficiency gain
Uninsulated flanges and valves account for a disproportionate share of distribution losses
03
Steam Leak Work Orders
Recurring Task
Steam leaks at flanges, valve packing, and fittings are found continuously — not just in annual surveys. OxMaint enables any technician to log a steam leak observation as a work order from a mobile device, attaching location, photo, and estimated leak size. These feed a live steam loss calculation dashboard, showing aggregate waste in lbs/hour and estimated annual cost across all open leak tickets.
Mobile-logged leak tickets reduce time from discovery to repair by cutting the verbal-report lag entirely
Each leak work order closes with an actual repair cost logged against estimated savings for ROI tracking
04
Savings Dashboard
Management Visibility
OxMaint aggregates closed steam-related work orders into a savings dashboard showing: estimated annual steam loss before repairs, actual repair cost, payback period, and total utility cost reduction realized to date. This converts your maintenance team's work into a financial report that justifies continued investment in steam efficiency programs — useful for sustainability reporting and capital budget conversations.
Filter by plant, building, or steam system zone to isolate high-waste areas
Export as PDF for monthly plant director or EHS sustainability reporting
How much steam is your pharma plant losing right now?
OxMaint tracks every failed trap, insulation gap, and steam leak as a linked work order — and shows the cumulative savings when each is fixed. See it live in your facility's data.
Steam Savings by the Numbers: What Pharma Plants Achieve
| Program Component |
Typical Saving |
Payback Period |
OxMaint Tracking Method |
| Steam trap survey + replacement program |
$6,640+ per failed trap/yr |
Under 6 months (DOE) |
Trap survey work orders + failure status asset field |
| Pipe and valve insulation repair |
5–10% system efficiency gain |
1–2 years |
Insulation deficiency work orders with heat loss estimate |
| Steam leak identification and repair |
10–20% of distribution losses |
Under 12 months |
Mobile-logged leak work orders + live loss aggregation |
| Boiler efficiency optimization |
8–15% fuel cost reduction |
6–18 months |
Boiler PM work orders + utility cost trend dashboard |
| Condensate return rate improvement |
15–25% water and chemical cost savings |
1–3 years |
Condensate system inspection work orders + trend graph |
Expert Perspective
PE
Most pharma plant engineers know they are losing steam — they just cannot tell you where or how much. The problem is not awareness, it is the absence of a system that connects the survey finding to a work order, the work order to a repair, and the repair to a measurable dollar figure. When you build that chain in a CMMS, steam efficiency stops being a one-off audit project and becomes an ongoing operational metric. That shift is what separates plants that hit their sustainability and utility cost targets from those that keep resetting them every year.
Process Plant Energy Engineer
Pharmaceutical and specialty chemical plant utilities, 18 years experience
Steam Trap Survey Frequency Guide for Pharma Plants
| System Type |
Recommended Survey Frequency |
Target Failure Rate |
Priority Zone |
| High-pressure steam header traps |
Quarterly |
Under 5% |
Critical |
| Process steam traps (autoclaves, SIP) |
Quarterly |
Under 5% |
Critical |
| HVAC steam distribution traps |
Annually |
Under 10% |
High |
| Low-pressure condensate return traps |
Annually |
Under 10% |
Medium |
| Trace heating and drip traps |
Every 2 years |
Under 15% |
Standard |
Frequently Asked Questions
How does OxMaint calculate steam savings from completed work orders?
When a steam trap repair or insulation work order is created, the technician logs the estimated steam loss rate (in lbs/hour or equivalent cost per year) as a field on the work order. When the work order closes, OxMaint records the actual repair cost and timestamps the fix. The savings dashboard aggregates all closed steam work orders and displays cumulative estimated annual savings versus actual repair spend — giving plant directors a clear, defensible ROI figure.
Start a free trial to see the savings dashboard with sample data.
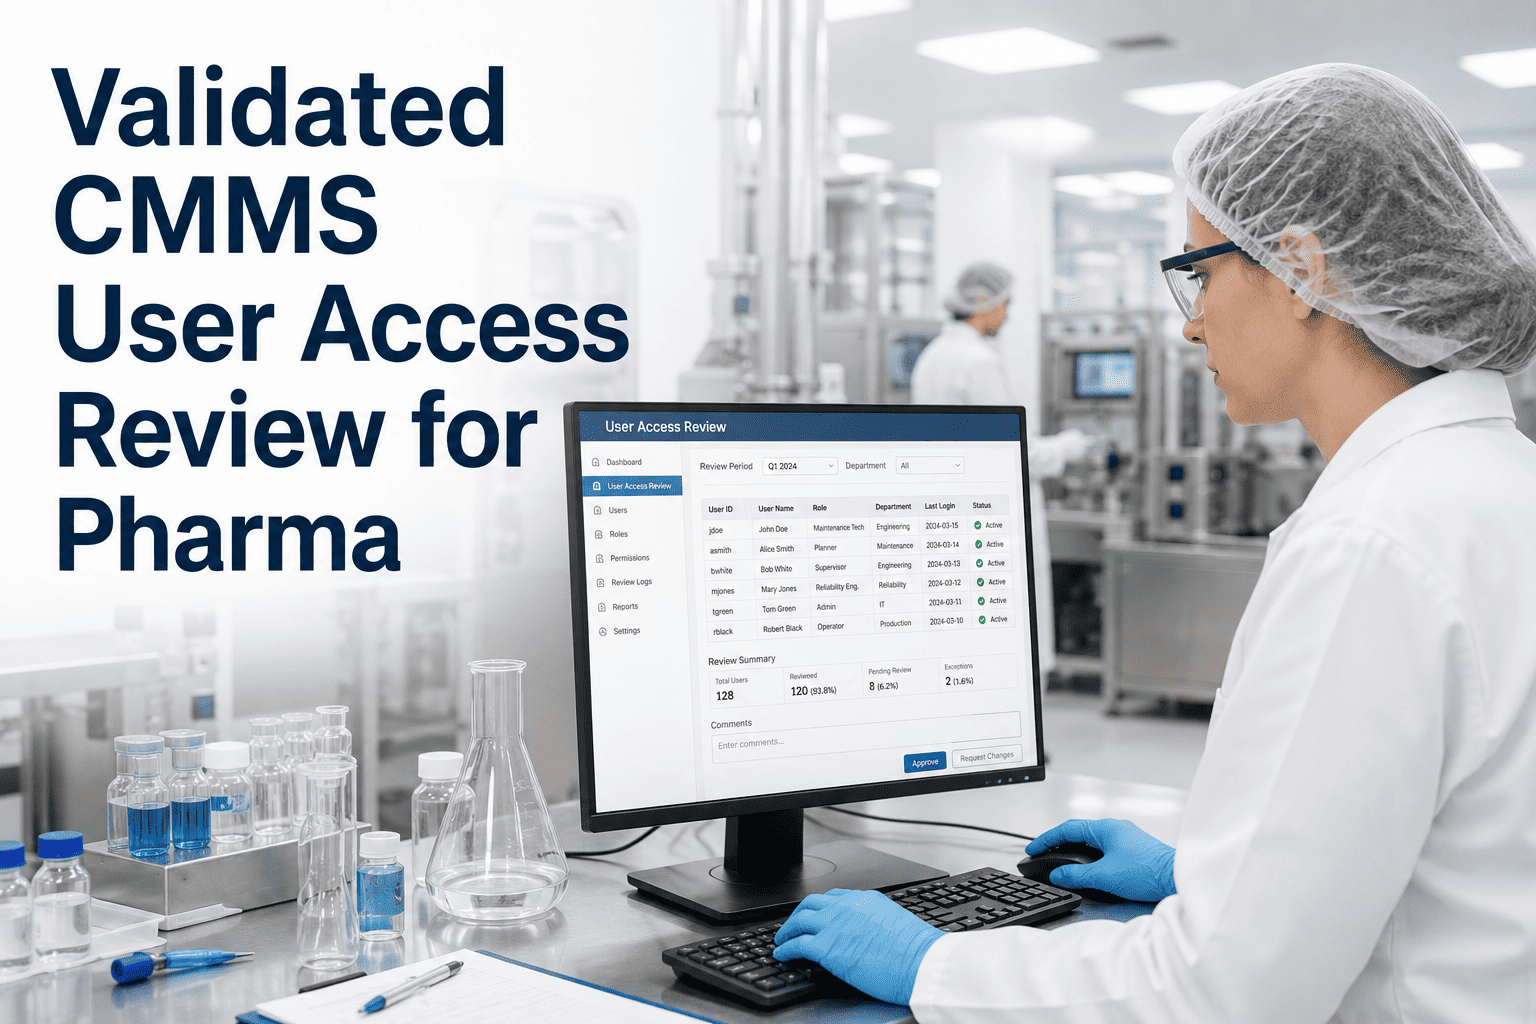
Can OxMaint manage steam trap survey programs across multiple pharma sites?
Yes. OxMaint's multi-site asset hierarchy allows all pharma campuses to share one survey program while keeping individual site records separate. Trap survey work orders can be assigned by site, and failure rates and savings dashboards can be viewed per plant or rolled up across the entire portfolio. This is valuable for corporate sustainability reporting, where aggregate steam savings need to flow into a single energy reduction figure.
Book a demo to see multi-site steam tracking configured.
What does a steam trap survey work order in OxMaint capture?
Each trap survey work order in OxMaint captures: trap ID and asset tag, location (building, floor, system zone), trap type (thermodynamic, float and thermostatic, inverted bucket), test method used, test result (operational, failed-open, failed-closed, bypassed), steam loss estimate in lbs/hour, and technician sign-off with timestamp. Failed traps automatically trigger a linked repair work order — creating a documented chain from finding to fix that is available for energy audit review without any manual transcription.
How does steam system tracking connect to pharma sustainability reporting?
OxMaint's steam savings dashboard exports data that maps directly to Scope 1 and Scope 2 emissions reduction calculations for GHG reporting. Fuel savings from boiler efficiency improvements and reduced steam generation needs translate to lower natural gas consumption and CO₂ emissions. For pharma companies with published net-zero commitments,
OxMaint's reporting suite provides the underlying work order evidence required to support reported emissions reductions — not just estimates.
Every failed trap in your pharma plant is writing a check your utility budget is cashing.
OxMaint connects steam trap surveys, insulation audits, and leak repairs to a single savings dashboard — so your team's work shows up as real dollar reductions, not just maintenance activity.